

Highlights
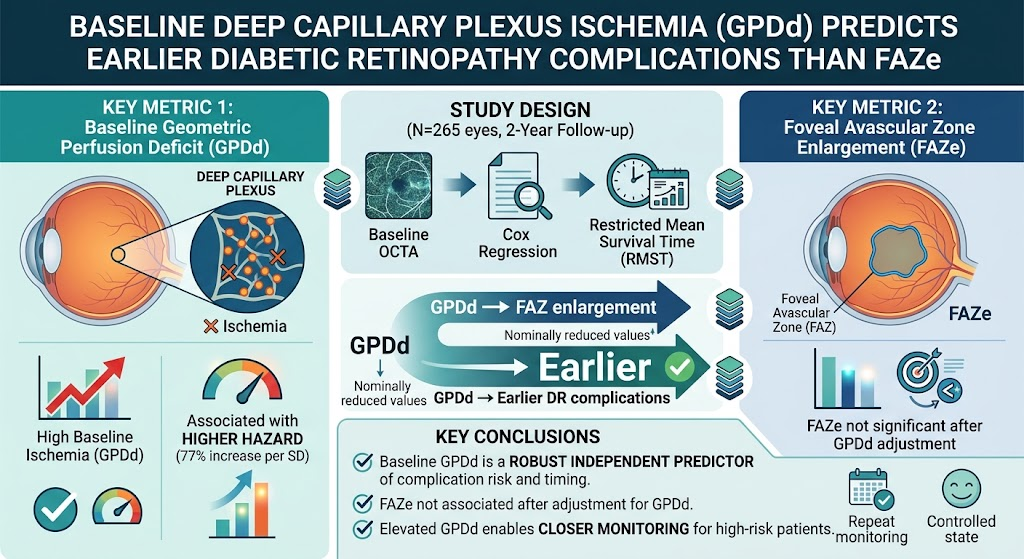
- Deep capillary plexus geometric perfusion deficit (GPDd) independently predicts earlier onset and increased risk of diabetic retinopathy (DR) complications over two years.
- Foveal avascular zone enlargement (FAZe) does not independently predict DR complication timing after adjustment for GPDd, despite correlation with macular ischemia and visual acuity decline.
- Quantitative OCTA metrics, especially GPDd, serve as robust, noninvasive biomarkers correlating with ultra-widefield fluorescein angiography retinal nonperfusion and functional impairment.
- GPDd measurement enables refined risk stratification beyond traditional DR severity scales, facilitating personalized monitoring and timely intervention.
Background
Diabetic retinopathy (DR), a leading cause of preventable vision loss worldwide, involves progressive microvascular damage and retinal ischemia. Timely identification of patients at high risk for complication development remains critical to optimizing surveillance and therapeutic strategies to prevent vision-threatening sequelae such as diabetic macular edema (DME), vitreous hemorrhage, and proliferative diabetic retinopathy (PDR). Traditional clinical grading scales based on fundoscopic and fluorescein angiographic findings are valuable but limited in capturing early or subclinical microvascular changes.
Optical coherence tomography angiography (OCTA) is an emerging noninvasive imaging modality that quantifies retinal microvascular perfusion, enabling layer-specific assessment of capillary plexuses. Among OCTA-derived metrics, geometric perfusion deficit (GPD) — defined as retinal tissue areas more than 30 μm from the nearest perfused capillary — has emerged as a sensitive marker of retinal ischemia, especially in the deep capillary plexus (DCP). Concurrently, the foveal avascular zone (FAZ) enlargement, reflecting discrepancies between structural and functional capillary beds, has been investigated as a marker of macular ischemia, with some correlation to visual acuity impairment.
Recent research efforts focus on the prognostic value of these OCTA biomarkers for DR complication risk and progression, aiming to improve clinical triage and personalized medicine approaches.
Key Content
Evidence from the 2026 Prospective Cohort Study by Zhuang et al.
Zhuang and colleagues conducted a pivotal prospective cohort study encompassing 265 eyes from 175 patients across the full DR severity spectrum. They quantified baseline geometric perfusion deficit in the DCP (GPDd) and foveal avascular zone enlargement (FAZe) using 3×3 mm OCTA imaging and compared their predictive value for DR complications over two years. Complications were comprehensively defined, including ≥10-letter loss in best-corrected visual acuity (BCVA), DR severity progression, vitreous hemorrhage, initiation of anti-VEGF therapy, and panretinal photocoagulation.
Multivariable Cox regression analyses — adjusted for key confounders like age, sex, HbA1c, diabetes duration, and hypertension — revealed that a 1 standard deviation (3.62%) increase in GPDd was associated with a 77% higher hazard of DR complications (p<0.001). Respective restricted mean survival time analyses showed a 70-day reduction (95% CI -103.9 to -36.0; p<0.001) in complication-free survival per 1 SD increase in GPDd. Dichotomizing based on the optimal Youden’s J-index cutoff for referable DR, eyes with high GPDd developed complications approximately 117 days (~4 months) earlier than those with low GPDd.
By contrast, while FAZe correlated with DR severity and visual function in univariate analyses, it did not independently predict complication risk or earlier onset after adjustment for GPDd.
Complementary Cross-Sectional and Longitudinal Studies Supporting OCTA Biomarkers
Other recent studies corroborate and extend these findings. A 2026 cross-sectional study (pmid 41912063) demonstrated that GPDd better predicts regional retinal nonperfusion patterns on ultra-widefield fluorescein angiography (UWF-FA) than FAZe, especially outside posterior pole regions, highlighting its utility as a biomarker for global ischemic burden.
Similarly, a one-year longitudinal validation study (pmid 42396532) confirmed that baseline DCP vessel density and GPD predict DR complications in referable DR, with DCP metrics improving prognostic accuracy beyond clinical grading alone.
Furthermore, research has demonstrated that GPDd strongly correlates with DR severity and detects clinically referable eyes with high sensitivity and specificity (AUC ~0.965), outperforming traditional vessel density parameters (pmid 35661804).
Functional Correlations and Implications for Visual Acuity
Foveal avascular zone enlargement has been linked to visual impairment metrics such as BCVA and low-luminance visual acuity (pmid 39675475), serving as a marker for foveal ischemia. However, the incremental value of FAZe over GPDd in predicting clinically meaningful complications appears limited.
Additional investigations have revealed associations between disorganization of retinal layers (DRIL/DROL), functional deficits on microperimetry, and OCTA ischemia markers (pmid 38604502), further elucidating the structural-functional axis of DR pathophysiology.
Technical Advances and Regional Ischemia Patterns
OCTA’s ability to discern perivenular capillary rarefaction and geometric perfusion deficits in both superficial and deep capillary plexuses across DR stages (pmid 36875334) reinforces the characterization of ischemia at microvascular levels.
Correlating macrophage-like cell densities with GPDd and UWF-FA ischemia indices (pmid 38652673) suggests potential mechanistic links between inflammation and microvascular nonperfusion.
Expert Commentary
The integration of OCTA-derived deep capillary plexus ischemia metrics, particularly geometric perfusion deficit (GPDd), marks a significant advance in DR risk stratification. Unlike FAZe, which mainly captures macular center ischemia, GPDd provides a quantifiable and reproducible measure of tissue hypoperfusion extending beyond the fovea, encompassing regions where ischemia may precede clinical manifestations. The demonstrated association between increased GPDd and both earlier and higher risk of complications is clinically meaningful for tailoring patient monitoring intervals and intensifying management for high-risk eyes.
While FAZe correlates with visual function impairment, its prognostic utility as an independent risk marker diminishes when analyzed alongside GPDd, highlighting the nuanced roles of these biomarkers.
Despite these promising findings, several considerations persist. Studies to date generally focus on 3×3 mm macular scans, which provide limited spatial coverage compared to ultrawidefield imaging, potentially underestimating peripheral ischemia. Furthermore, technical variability across OCTA devices and image acquisition protocols necessitates standardization for broader clinical application.
The exclusion of DR severity from the primary multivariate analyses in the key cohort study reflects high collinearity with OCTA metrics but also limits direct comparison with traditional staging systems. Larger prospective trials with diverse populations and longer follow-up are warranted to confirm and extend these results.
From a mechanistic standpoint, the perivenular predilection of ischemic changes observed may relate to microvascular architecture and leukostasis phenomena, inviting research into anti-inflammatory or neuroprotective adjuncts targeting ischemic pathways.
Conclusion
Emerging evidence robustly supports geometric perfusion deficit in the deep capillary plexus as a superior, time-sensitive biomarker for predicting diabetic retinopathy complications relative to foveal avascular zone enlargement. GPDd quantification via OCTA enables earlier risk identification, facilitating personalized surveillance and timely therapeutic interventions. While FAZe remains valuable for assessing foveal ischemia and visual acuity decline, its independent prognostic role for complication timing is limited.
Future research should aim to standardize OCTA acquisition protocols, expand the inclusion of peripheral ischemia assessment, and investigate integration with emerging imaging biomarkers and systemic risk stratification tools. Such advances promise to refine DR management paradigms, reduce vision loss burden, and optimize allocation of healthcare resources.
References
- Zhuang K, Kakihara S, Busza A, Duffy B, AbdelSalam M, Fawzi AA. Baseline Deep Capillary Plexus Ischemia Predicts Earlier Diabetic Retinopathy Complications Than Foveal Avascular Enlargement. Am J Ophthalmol. 2026 Aug 14:S0002-9394(26)00464-2. doi: 10.1016/j.ajo.2026.08.014. PMID: 42600886.
- Fawzi AA, et al. Macular Optical Coherence Tomography Angiography Biomarkers Predict Regional Retinal Nonperfusion Patterns on Ultrawidefield Angiography in Diabetes. Am J Ophthalmol. 2026 Jul;287:198-207. doi: 10.1016/j.ajo.2026.03.031. PMID: 41912063.
- Joltikov K, et al. Validation of Deep Capillary Plexus OCTA Metrics as Predictors of Diabetic Retinopathy Complications: A One-Year Longitudinal Study. Res Sq. 2026 Jun 28. doi: 10.21203/rs.3.rs-9199781/v1. PMID: 42396532.
- Rodriguez-Carrillo M, et al. Foveal Avascular Zone Enlargement Significantly Improves Statistical Models for Detection of Diabetic Retinopathy Severity. Ophthalmol Retina. 2026 Apr;10(4):403-410. doi: 10.1016/j.oret.2025.10.018. PMID: 41197712.
- Minvielle W, et al. Baseline Nonperfusion and Deep Capillary Plexus Ischemia Predict Two-Year Retinal Nonperfusion Progression in Diabetic Retinopathy. Invest Ophthalmol Vis Sci. 2026 Jan 5;67(1):64. doi: 10.1167/iovs.67.1.64. PMID: 41615369.
- Sim DA, et al. Macular Perfusion Deficits on OCT Angiography Correlate with Nonperfusion on Ultrawide-field Fluorescein Angiography in Diabetic Retinopathy. Ophthalmol Retina. 2023 Aug;7(8):692-702. doi:10.1016/j.oret.2023.04.003. PMID:37061036.
- Pappuru RR, et al. Perivenular Capillary Rarefaction in Diabetic Retinopathy: Interdevice Characterization and Association to Clinical Staging. Ophthalmol Sci. 2023 Jan 3;3(2):100269. doi: 10.1016/j.xops.2023.100269. PMID: 36875334.
- Jose R, et al. Association between macrophage-like cell density and ischemia metrics in diabetic eyes. Exp Eye Res. 2023 Dec;237:109703. doi: 10.1016/j.exer.2023.109703. PMID: 38652673.
- Reis D, et al. Severity of Disorganization of Retinal Layers and Visual Function Impairment in Diabetic Retinopathy. Ophthalmol Retina. 2024 Sep;8(9):880-888. doi: 10.1016/j.oret.2024.04.005. PMID: 38604502.