Longitudinal Glycemic Trajectories in Adults with Type 1 Diabetes: Insights from a Three-Year Multicenter CGM Study

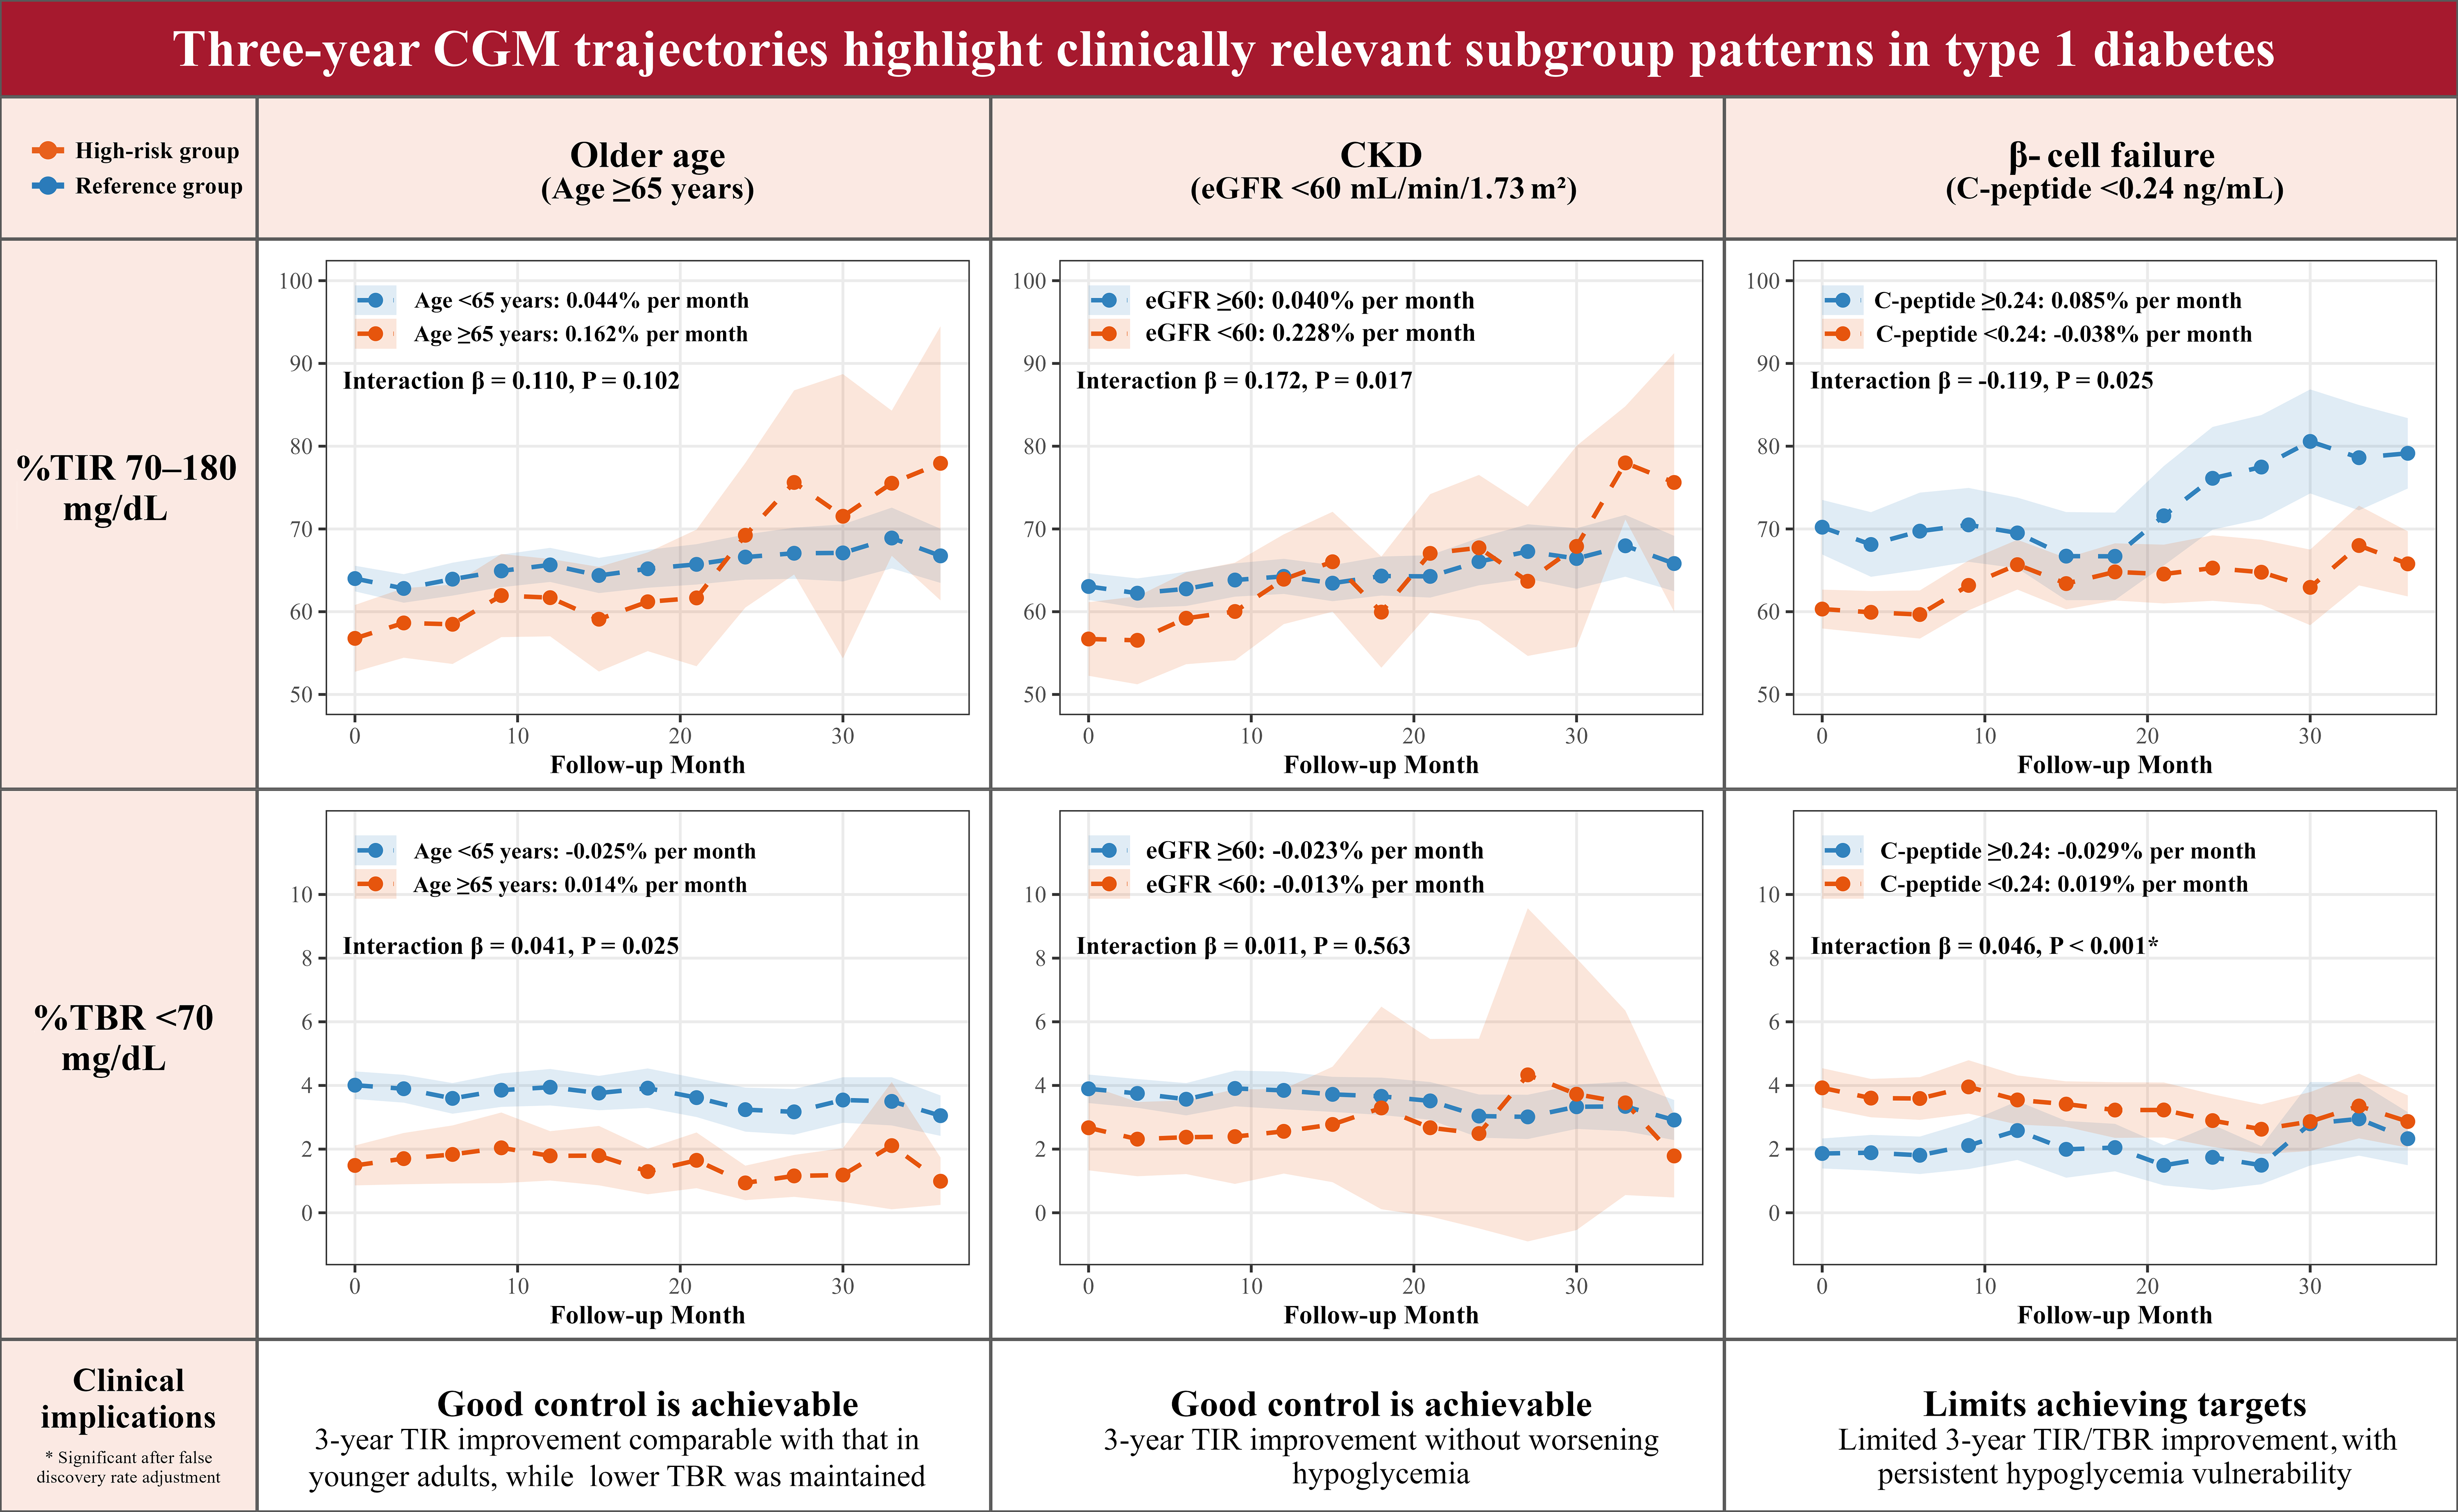
Six line graphs compare three-year continuous glucose monitoring trajectories by age, chronic kidney disease, and beta-cell failure. Time in range from 70 to 180 milligrams per decilitre generally increases across follow-up months, while time below range under 70 milligrams per decilitre remains lower. Each comparison presents high-risk and reference groups with monthly rates, interaction beta values, P values, and variability bands. Clinical implications state that good control is achievable for older age and chronic kidney disease groups, while beta-cell failure limits achieving targets.

Highlight

  • Older age and chronic kidney disease (CKD) subgroups demonstrated improvements in glycemic control over three years without increased hypoglycemia risk.
  • Severe β-cell failure was associated with more glycemic variability and hypoglycemia, limiting improvements in glucose control despite monitoring.
  • Higher BMI and elevated triglyceride-glucose (TyG) index were linked to lower absolute time in range (TIR), but those with highest TyG showed greater glycemic improvement longitudinally.
  • Considerable intragroup variability supports tailoring glycemic targets informed by continuous glucose monitoring (CGM) trajectories rather than uniform goals.

Comments

No comments yet. Why don’t you start the discussion?

Leave a Reply