Introduction
Cancer remains a significant public health challenge in the United States, ranking as the second-leading cause of death overall and the primary cause of death among individuals under 85 years of age. Despite sustained declines in cancer mortality over recent decades, the nation faces persistent challenges, including increasing incidence for several common cancers, profound socioeconomic and racial disparities, and a potential rise in late-stage cancer diagnoses partly attributable to pandemic-related delays in care. This comprehensive report projects the cancer burden for 2026 based on state-of-the-art population-based data and assesses trends through 2023/2022 for mortality and incidence, respectively.
Data Sources and Methodology
Incidence data derive from the National Cancer Institute’s Surveillance, Epidemiology, and End Results (SEER) program and the CDC’s National Program of Cancer Registries (NPCR), collectively covering nearly 100% of the U.S. population through data standardization, case reporting delay adjustments, and cancer classification per authoritative coding systems. Mortality data, spanning from 1930 through 2023, are sourced from the National Center for Health Statistics (NCHS), verified across states, and adjusted for age and demographic variables.
Projected cancer cases and deaths for 2026 are estimated using robust, data-driven Joinpoint regression models incorporating sociodemographic, lifestyle, and regional variation factors. Lifetime cancer risk estimates leverage the NCI’s DevCan software, excluding the anomalous 2020 incidence data influenced by the COVID-19 pandemic. Relative survival analyses utilize the Ederer II method to calculate net cancer survival by stage, race, and year of diagnosis, with active cohort follow-up through 2022.
Projected Cancer Burden in 2026
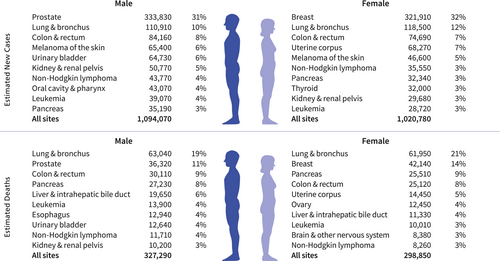
Approximately 2,114,850 new invasive cancer cases are anticipated, alongside 626,140 cancer deaths in the United States. Key patterns include:
– The lifetime probability of being diagnosed with invasive cancer is nearly one in three for both men (39.2%) and women (38.7%).
– Most cancer diagnoses (60%) occur in individuals aged 65 years and older; however, there is an increasing proportion among younger adults aged 50-64 years (28%) and under 50 years (12%).
– Leading new cancer diagnoses in men include prostate (around one-third), lung and bronchus, and colorectal cancers, collectively accounting for nearly half of all male cases.
– In women, breast cancer accounts for nearly one third of new diagnoses, followed by lung and colorectal cancers, jointly comprising about 50% of diagnoses.
– Lung cancer remains the leading cause of cancer death, exceeding deaths from colorectal and pancreatic cancers combined, with approximately 182,830 deaths in 2026 attributable to cigarette smoking and secondhand exposure.
Incidence and Mortality Trends
Overall cancer incidence has been relatively stable in recent years, with sex-specific differences observed:
– Male incidence rose sharply in the early 1990s due to prostate-specific antigen (PSA) screening, followed by a decline until 2014 and stabilization thereafter.
– Female incidence gradually increased since the late 1970s, narrowing the male-to-female incidence rate ratio from 1.6 in 1992 to 1.1 in 2022.
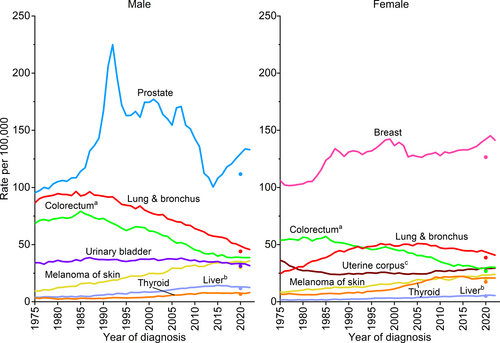
Specific cancer trends highlighted include:
– Prostate cancer incidence declined sharply from 2007 to 2014 (mainly localized cases) following USPSTF recommendations against widespread PSA screening, but has steadily increased since 2014, especially for regional and distant stages.
– Breast cancer incidence has risen slowly since the mid-2000s, primarily driven by localized and hormone receptor-positive subtypes, with more pronounced increases in Hispanic and Asian American populations and women under 50 years.
– Lung cancer incidence continues to decline more rapidly in men than women, reflecting historical and ongoing differences in smoking behaviors.
– Colorectal cancer incidence has decreased overall but increased among adults under 50 years, partly due to earlier screening initiation.
– Some cancers, such as liver and oropharyngeal cancers associated with HPV, have stabilized or risen modestly.
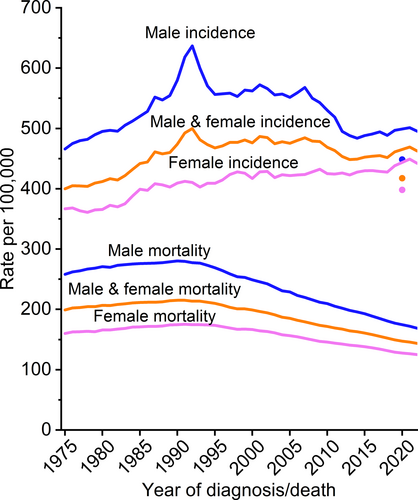
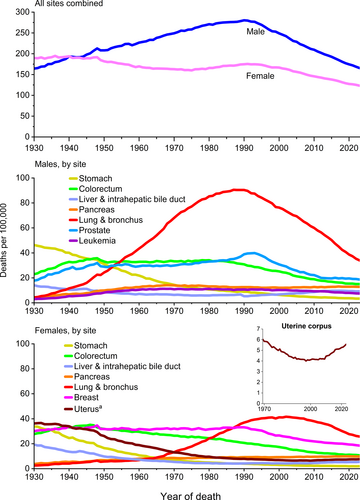
Cancer mortality has declined markedly since peaks in the 20th century, driven by reduced tobacco use, enhanced screening, and treatment advances:
– Overall cancer death rates have fallen by 34% from 1991 to 2023, resulting in an estimated 4.8 million deaths averted.
– Lung cancer death rates decreased 62% in men and 38% in women from their respective peaks, with accelerated mortality declines over the past decade due to early detection and better therapies.
– Colorectal cancer mortality dropped by over half since the 1980s.
– Breast cancer mortality peaked in 1989 and has since declined by 44%, mediated largely by treatment improvements.
– Melanoma mortality declined quickly starting in 2013 due to breakthrough therapies.
– Liver cancer mortality in men recently began to decline but continues to rise in women.
– Mortality rates for uterine corpus and HPV-associated oral cancers have increased in recent years.
Cancer Survival
Five-year relative survival for all cancers combined has improved substantially, from 49% in the mid-1970s to a milestone 70% for diagnoses in 2015-2021. Noteworthy features include:
– Highest survival rates (>95%) are seen in thyroid, prostate, testis, and melanoma.
– Lowest survival rates (~13-28%) remain for pancreatic, lung, and liver cancers.
– Improvements reflect advances in treatment, earlier detection, and shifts in tumor subtype distributions.
– Survival gains are particularly notable for advanced-stage diagnoses in high-mortality cancers such as myeloma (32% to 62%), liver cancer (7% to 22%), metastatic melanoma (16% to 35%), metastatic rectal cancer (8% to 18%), and lung cancer (regional stage 20% to 37%, distant stage 2% to 10%).
Cancer Disparities
Racial, ethnic, and socioeconomic disparities persist:
– American Indian/Alaska Native (AI/AN) populations exhibit the highest overall cancer incidence and mortality, especially among women.
– Black men have the highest prostate cancer incidence and mortality rates.
– Hispanic and Asian American populations generally have lower overall cancer risk but higher liver and stomach cancer mortality.
– Disparities partly arise from differences in risk factor prevalence (e.g., smoking), access to high-quality care, medical mistrust, and insurance barriers.
– Black patients have lower cancer survival rates than White patients after controlling for stage and socioeconomic factors, primarily due to differential access to timely, guideline-concordant treatment.
– Structural racism, neighborhood disadvantage, and poverty exacerbate disparities by influencing carcinogen exposure, screening uptake, stage at diagnosis, and treatment quality.
Geographic Variation
Cancer incidence and mortality vary substantially by state:
– Death rates range from 122-128 per 100,000 in states like Utah, Hawaii, New York, and Colorado to 178-180 per 100,000 in West Virginia, Mississippi, and Kentucky.
– These differences align with regional disparities in smoking prevalence and public health policies.
– Cervical cancer incidence varies two-fold between states, with higher rates in southern states with lower HPV vaccination coverage.
Cancer in Children and Adolescents
Cancer ranks as the second leading cause of death among children aged 1–14 and fourth among adolescents aged 15–19 years.
– In 2026, an estimated 9,680 children and 5,660 adolescents will be diagnosed, with 1,090 and 730 deaths expected, respectively.
– Leukemia is the most common childhood cancer, followed by central nervous system (CNS) tumors.
– Adolescents have a higher proportion of CNS tumors, lymphomas, and thyroid carcinomas.
– Invasive cancer incidence declined slightly in children but increased modestly in adolescents.
– Mortality has decreased substantially, reflecting improved leukemia therapies, though survival in adolescents lags behind children for some cancers.
– Long-term survivors face elevated risks for treatment-related health issues and accelerated aging.
Limitations
Projected incidence and mortality estimations are model-based and reflect data up to 2022/2023. Interpretations should consider:
– Methodological changes over time, model sensitivity to abrupt incidence shifts, and COVID-19 pandemic-related disruptions.
– Racial and ethnic misclassification in medical and death records, especially in Native American populations.
– Lack of detailed data for LGBTQ+ populations and limited granularity for broadly defined racial and ethnic groups, masking heterogeneity.
Conclusion
Cancer control efforts in the U.S. have yielded substantial progress with declining mortality and improving survival, resulting in 4.8 million deaths averted since 1991. These gains are primarily driven by reductions in smoking, earlier detection, and treatment innovations. Despite these strides, lung cancer remains the leading cause of cancer death and incidence is increasing for several common cancers. Persistent disparities by race, ethnicity, socioeconomic status, and geography pose critical challenges. The potential impact of federal budget cuts on cancer research and healthcare access threatens to undermine progress, emphasizing the need for sustained investment in equitable cancer prevention, diagnosis, and treatment strategies.
References
Siegel RL, Kratzer TB, Wagle NS, Sung H, Jemal A. Cancer statistics, 2026. CA Cancer J Clin. 2026 Jan-Feb;76(1):e70043. doi: 10.3322/caac.70043 IF: 232.4 Q1