Highlights
– In a population-based cohort (Rotterdam Study subcohort), higher cartilage T2 relaxation times were associated with MRI-defined tibiofemoral osteoarthritis and with BMI.
– Lateral compartment cartilage subregions (lateral weight-bearing femur, lateral tibia, lateral posterior femur) showed the strongest T2–OA associations; T2 did not correlate with KOOS-based symptoms.
– T2 mapping may capture early biochemical or compositional cartilage alterations in a population setting, but cross-sectional design and female-only imaging limit causal inference and generalizability.
Background: clinical context and unmet need
Knee osteoarthritis (OA) is a leading cause of pain, functional limitation, and healthcare utilization worldwide. Conventional radiography detects structural changes late in the disease process (joint-space narrowing, osteophytes) and is relatively insensitive to early biochemical alterations in cartilage. Quantitative MRI sequences that probe cartilage composition—such as T2 relaxation time mapping—promise earlier detection of cartilage degeneration, objective monitoring of progression, and potential use as outcome measures in clinical trials.
T2 relaxation time reflects interactions of water molecules with the collagen network and proteoglycan content in hyaline cartilage; elevated T2 values typically indicate increased water mobility and collagen matrix disorganization. Most evidence for T2 as a biomarker comes from case-control and small longitudinal cohorts; population-based data remain limited, yet are crucial to define the range and correlates of T2 variability in community-dwelling adults and inform translational use.
Study design and population
This cross-sectional analysis used a subcohort of the Rotterdam Study and included 673 female participants who underwent 1.5-T MRI of the knees. A total of 1,332 knees were analyzed (bilateral where available). T2 relaxation times were computed in six anatomically defined femoral and tibial cartilage regions of interest (ROIs), capturing weight-bearing and posterior subregions in medial and lateral compartments.
Outcomes and covariates included MRI Osteoarthritis Knee Score (MOAKS)-based tibiofemoral OA classification, the Knee injury and Osteoarthritis Outcome Score (KOOS) for symptoms, and key participant characteristics (age, body mass index [BMI]). Multivariate fixed-effects regression models evaluated associations between regional T2 values and presence of MRI-based OA and symptom status, adjusted for covariates.
Key findings
Overall patterns and descriptive results
Of 1,332 knees, 237 (17.7%) had MRI-defined tibiofemoral OA. Across all cartilage ROIs, knees with OA had higher mean T2 relaxation times compared with knees without OA. Correlation analyses showed positive associations between T2 values and BMI (Pearson r range 0.17–0.46), with the strongest correlations in lateral compartment subregions. Associations between T2 and age were weak.
Adjusted associations with MRI-defined OA
After multivariable adjustment, specific regional T2 values were independently associated with the presence of MOAKS-based tibiofemoral OA. The reported odds ratios (OR) and 95% confidence intervals (CI) were:
- Lateral weight-bearing femur: OR 0.67 (95% CI 0.56–0.79).
- Lateral tibia: OR 1.11 (95% CI 1.00–1.24).
- Lateral posterior femur: OR 1.48 (95% CI 1.28–1.72).
- Medial posterior femur: OR 1.14 (95% CI 1.01–1.30).
Interpretation requires attention to the directionality and modeling choices in the published analysis; nevertheless, the lateral compartment—particularly posterior femoral and tibial cartilage—showed consistent relationships between higher T2 relaxation times and MRI evidence of OA.
Symptoms and T2
T2 relaxation times were not associated with KOOS-based symptom status in adjusted analyses. In other words, higher T2 values—although linked to imaging-defined cartilage degeneration—did not correspond to patient-reported symptoms in this cross-sectional cohort.
Correlates: BMI and age
The study found a notable positive correlation between BMI and T2 across cartilage regions (r = 0.17–0.46), strongest in the lateral compartment. Associations with chronological age were weak, suggesting that compositional cartilage changes measurable by T2 may reflect mechanical or metabolic factors (for example, obesity-driven joint loading or adipose-related inflammation) in addition to, or rather than, simple aging effects in this middle-aged female cohort (mean age 59.8 ± 3.7 years).
Expert commentary: interpretation, strengths and limitations
Biological plausibility and mechanistic insights
T2 mapping primarily reflects cartilage water content and collagen matrix integrity. Elevated T2 values can arise from increased hydration and disorganized collagen architecture—early signs of cartilage degeneration preceding gross morphological loss. The observed link between BMI and T2 is biologically plausible; higher mechanical loading and adiposity-associated inflammatory mediators may accelerate matrix breakdown, producing higher T2 relaxation times detectable in vivo. The lateral compartment predominance in associations may relate to differing load distribution patterns, variable susceptibility to focal degeneration, or methodological factors in segmentation.
Strengths
- Large population-based sample with standardized MRI acquisition and semi-quantitative MOAKS scoring.
- Regional T2 quantification across multiple cartilage subregions allowed nuanced assessment of compartmental differences.
- Multivariate regression adjusted for important covariates and used fixed-effects modeling across knees, which can account for within-subject correlation.
Limitations and generalizability
- Cross-sectional design precludes causal inference and cannot determine whether higher T2 predicts incident structural OA or symptom development.
- The scanned subcohort consisted of females only (n=673); sex-specific cartilage properties and OA patterns limit generalizability to men.
- Use of 1.5-T MRI and specific sequence parameters may affect comparative T2 values versus 3-T systems; lack of laminar (superficial vs deep cartilage) analysis may blunt sensitivity to early changes.
- The apparent inverse OR for the lateral weight-bearing femur (OR 0.67) suggests modeling or coding complexities; careful reading of the original methods is required to interpret direction and scaling of exposures.
- T2 is influenced by technical factors (field strength, echo times, segmentation approach), and without external harmonization its utility for inter-center comparisons or multi-site trials is limited.
Comparison with prior evidence
Previous smaller and cohort-based studies have reported higher cartilage T2 in knees with OA or at risk for OA and associations with BMI and mechanical factors. The Rotterdam Study analysis adds population-scale evidence that compositional MRI metrics correlate with imaging-defined OA and with body composition in community-dwelling adults. The lack of correlation with symptoms echoes prior findings that imaging biomarkers and pain often show discordance, highlighting the complex biopsychosocial drivers of OA symptoms.
Implications for clinical practice and research
T2 mapping remains primarily a research tool rather than a routine clinical test. However, the study supports several potential uses:
- Early detection: T2 may detect biochemical cartilage changes before irreversible morphological loss, enabling earlier intervention in at-risk individuals.
- Risk stratification: The association with BMI suggests T2 could help identify obese individuals with early cartilage compromise who might benefit from weight-management interventions.
- Outcome measurement: In clinical trials of disease-modifying OA therapies, T2 mapping can serve as a sensitive biomarker of cartilage composition, complementary to structural scores and patient-reported outcomes.
To move toward clinical deployment, prospective longitudinal studies are needed to establish T2 thresholds predictive of progression, harmonization across MRI platforms and sequences must be achieved, and linkage between compositional changes and clinically meaningful endpoints (pain, function, joint replacement) should be demonstrated.
Recommendations for future research
Key next steps include:
- Longitudinal follow-up of population-based cohorts with baseline T2 to evaluate predictive performance for incident radiographic/MOAKS progression and symptom onset.
- Inclusion of both sexes and broader age ranges to assess demographic modifiers and generalizability.
- Standardization of acquisition protocols (field strength, multi-echo T2 sequences) and post-processing (laminar analysis, automated segmentation) to permit multi-center pooling and normative reference ranges.
- Investigation of mechanisms linking BMI to T2 (biomechanical loading vs adipokine-mediated matrix degradation) using integrated imaging, biomechanics, and biomarker approaches.
- Exploration of clinical utility: randomized trials that use T2 as an enrichment or surrogate endpoint to test lifestyle or pharmacologic interventions targeting early OA.
Conclusion
In this large, population-based sample of middle-aged women, cartilage T2 relaxation times were higher in knees with MRI-defined OA and correlated positively with BMI, particularly in lateral compartment subregions. T2 did not reflect KOOS-measured symptoms. These results support the biological and translational relevance of T2 mapping as a compositional imaging biomarker of cartilage health, while underscoring the need for longitudinal data, technical harmonization, and broader demographic sampling before routine clinical application.
Funding and clinicaltrials.gov
Funding sources and trial registration details were reported in the original publication: Harlianto NI, Hirvasniemi J, Poot DHJ, Klein S, Bierma-Zeinstra SMA, Schiphof D, Oei EHG. T2 mapping of the articular cartilage as a biomarker for knee osteoarthritis: An analysis of the population-based Rotterdam Study. Osteoarthritis Cartilage. 2025 Sep 18. doi:10.1016/j.joca.2025.09.009. PMID: 40975370. For complete funding and registry information, please consult the published article.
References
1. Harlianto NI, Hirvasniemi J, Poot DHJ, Klein S, Bierma-Zeinstra SMA, Schiphof D, Oei EHG. T2 mapping of the articular cartilage as a biomarker for knee osteoarthritis: An analysis of the population-based Rotterdam Study. Osteoarthritis Cartilage. 2025 Sep 18:S1063-4584(25)01158-6. doi: 10.1016/j.joca.2025.09.009. Epub ahead of print. PMID: 40975370.
2. Glyn-Jones S, Palmer AJR, Agricola R, et al. Osteoarthritis. Lancet. 2015 Jul 18;386(9991):376-387. doi:10.1016/S0140-6736(14)60802-3.
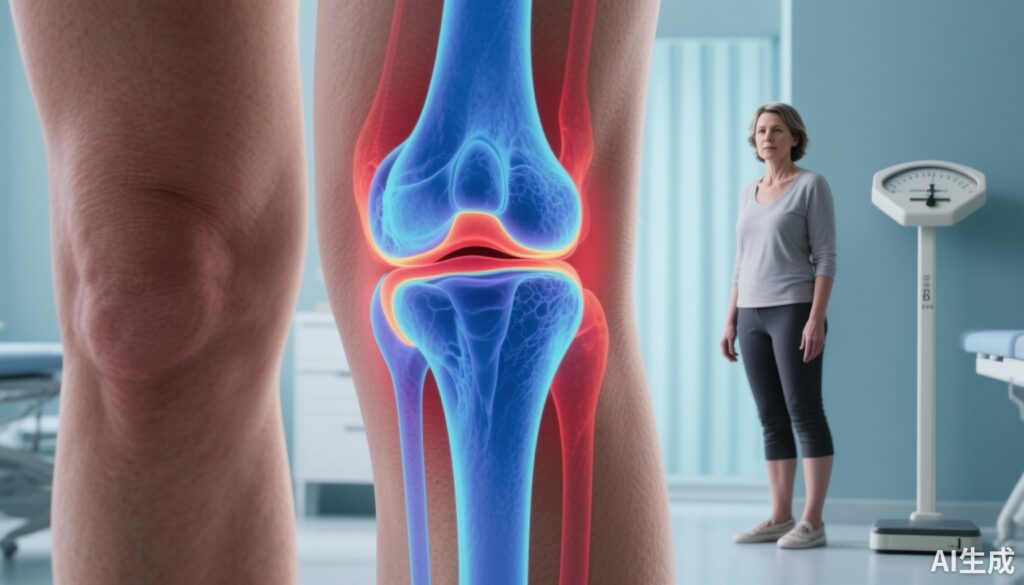
AI image prompt for article thumbnail
A clinical-style coronal MRI view of an adult knee with color-coded T2 relaxation map overlay (blue to red heatmap indicating low-to-high T2), foreground: middle-aged woman in casual clothing standing beside a BMI scale; soft clinical lighting, neutral background, clear focus on knee cartilage and T2 heatmap, realistic medical imaging aesthetic.